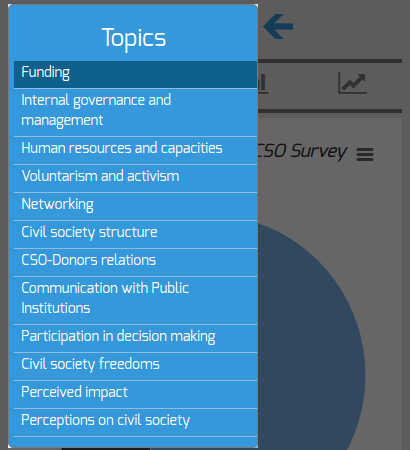
Select a topic you wish to analyze.
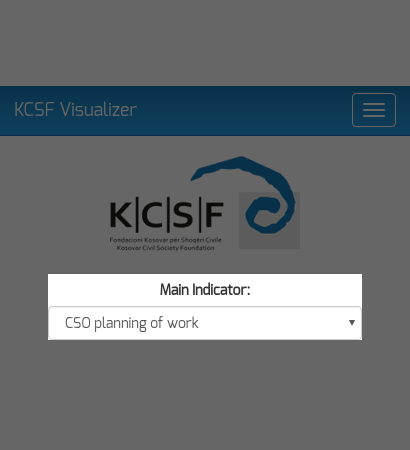
Specify the indicator you are interested in.
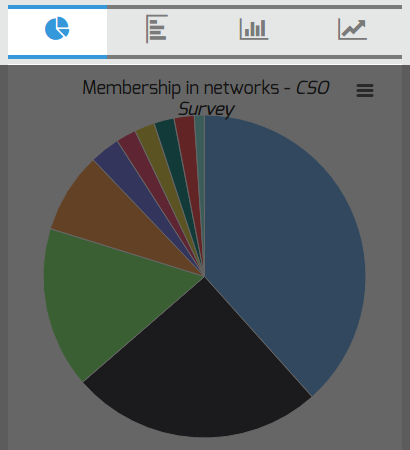
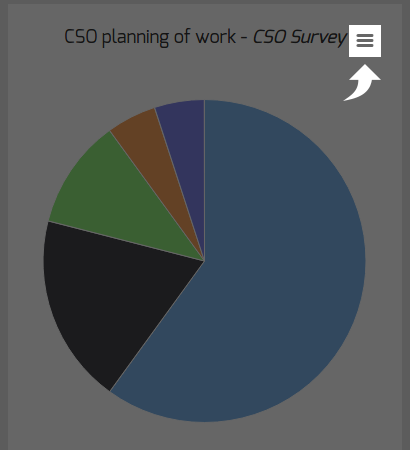
Visualize the data with one of four available charts
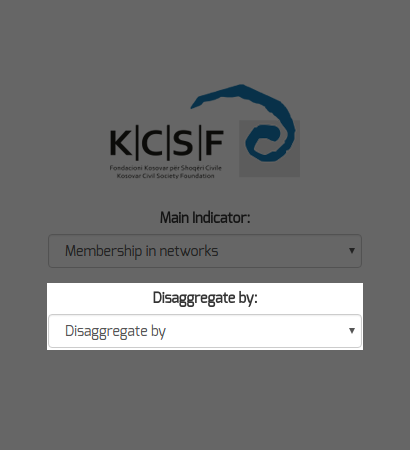
Dig deeper in how the data is distributed by applying disaggregation.
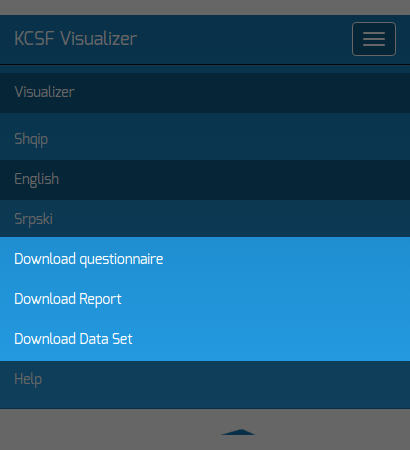
Download the report, datasets, and questionnaire.
Download chart in different formats.
-
Select a topic you wish to analyze.
-
Specify the indicator you are interested in.
next » « back -
Visualize the data with one of four available charts: a piechart, horizontal or vertical barcharts, or a pointchart.
next » « back -
Dig deeper in how the data is distributed by applying disaggregation.
« back next » -
Download the report, datasets, and questionnaire.
next » « back -
Download chart in different formats.
finish « back